
EDIT: It seems to have been fixed thanks to @[email protected]. Running analyze verbose; in postgres.
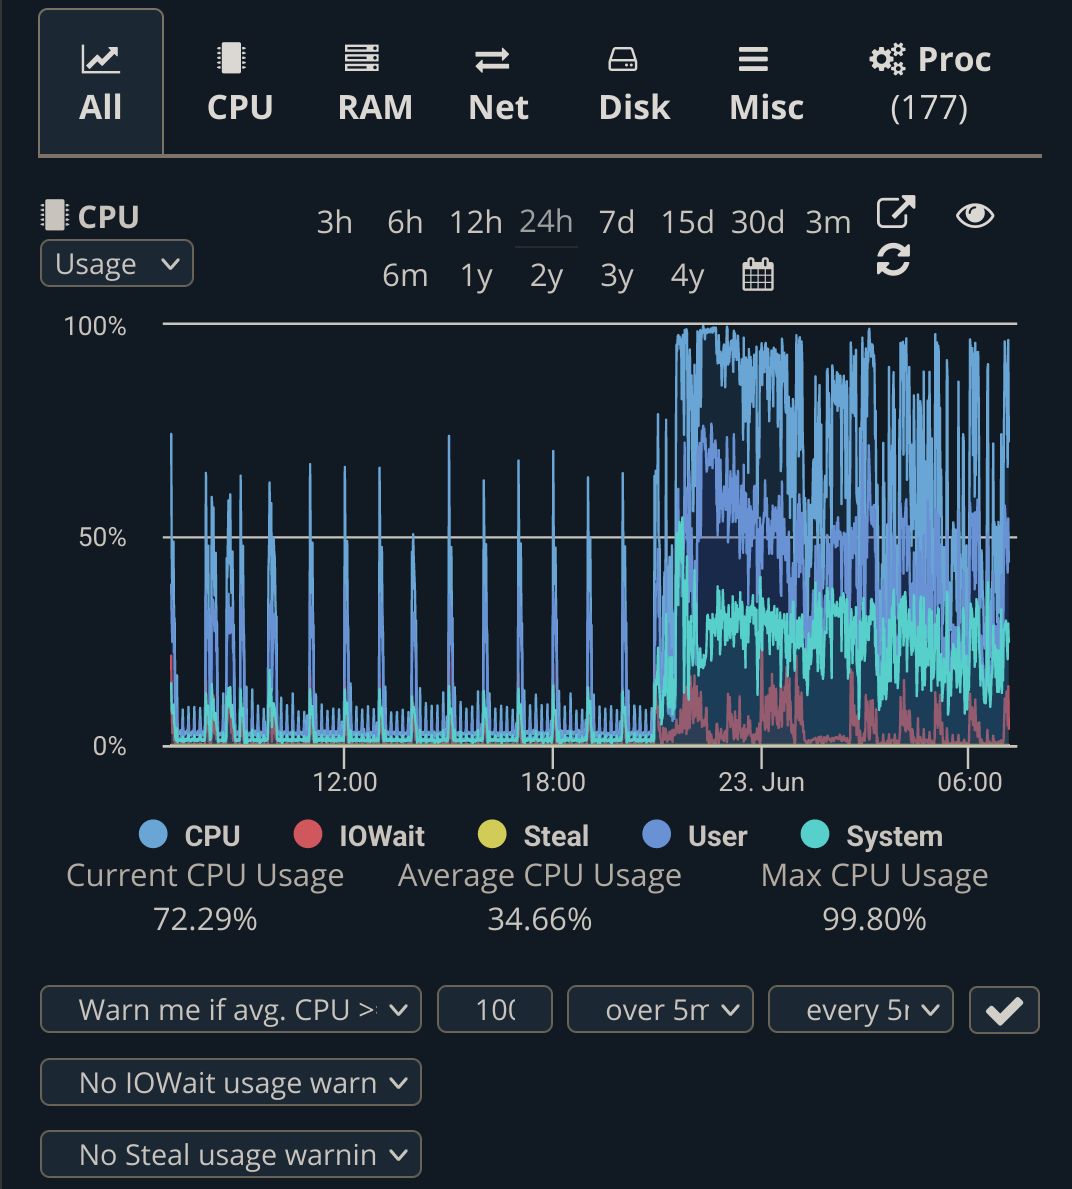
After updating to 0.19.5 from 0.19.3 my postgres is often using up 500%+ of CPU according to docker stats and often going to 100% CPU on most cores according to htop. Also noticed in the uptime monitor:
htop shows one of the 5 postgres processes constantly on UPDATE. I think this might be part of the problem.
I’m not comfortable with postgres and am honestly completely in the dark how or where to mitigate or even pinpoint this issue.
Any help would be appreciated.
hmm, how many connections are used
SELECT count(*) FROM pg_stat_activity;?I am not a master postgres admin but my intuition has been that the amount of connections is a big factor in how pg behaves with cpu and mem.
ERROR: extension "pg_stats_statements" is not availableEven though it’s added in the customPostgresql.conf
shared_preload_libraries = 'auto_explain,pg_stat_statements'According to this https://stackoverflow.com/a/72966651/5881796
The extension is not loaded:
CREATE EXTENSION pg_stat_statements;I added pg_stat_statements, and ran it. This was the result:
# SELECT count(*) FROM pg_stat_activity; count ------- 11 (1 row)do you also have pict-rs connected to this postgres instance? that is surprisingly low number to me, I would have expected anywhere between 20-50 active connections (I use 50 for lemmy and 20 for pict-rs, configured in their respective conf files)